
It’s often touted that investing in an S&P 500 index generates an average of 10% growth, but do you ever wonder where that often quoted “10% annual return” is derived from? It’s the historical Compounded Annual Growth Rate (CAGR) of the S&P 500 Index with dividends reinvested.
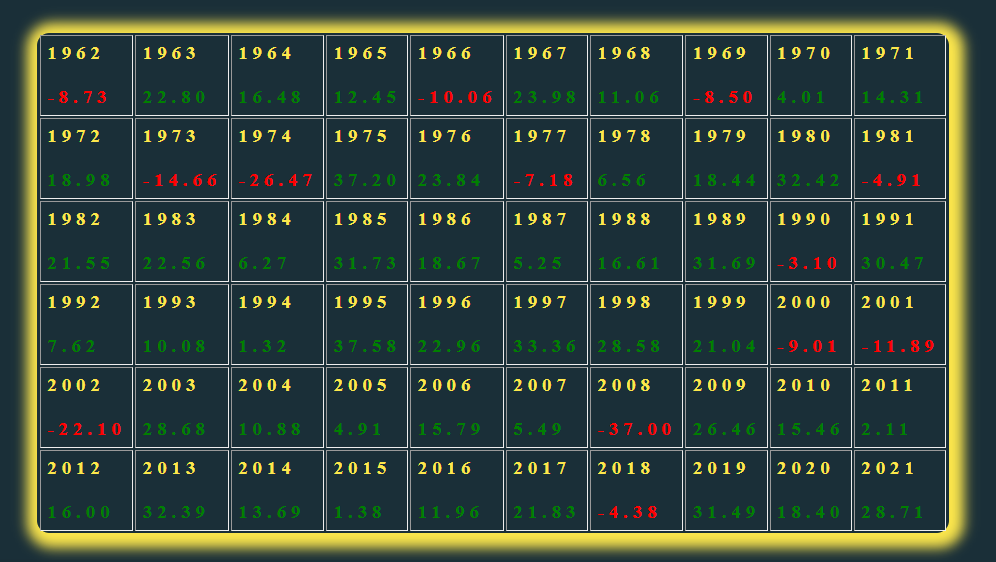
Although it’s heralded that the market returns roughly 10% annually, the figure is closer to about 6-7% after accounting for inflation. The above table shows the annual return of the S&P 500 Index from the last 60 years. For most of the years, the returns were excellent, and if you employed the buy-and-hold approach, dividends started to pay off for you! (pun intended).
Interestingly, it’s pretty rare that the average market return is 10% in a given year. When looking at this approx 60-year time horizon—from 1962-2021—the average market return was between 8% and 12%, only four times, but in reality, the returns are usually much higher or much lower.
If you’re panicking because you think the market changes its mind more often than Billie Eilish changes her hair color—you’d be correct; the market is cyclical because the economy contracts and expands, causing markets to rise and fall; this is natural. But don’t fret because there’s a silver lining to this drama, and If you stay invested for the long term, there’s a great chance you’ll be handsomely rewarded.
To put things in perspective, $100 invested in 1962 returns approximately $36.6k by the end of 2021! Although this is just an example, it justifies the power of long-term investing. As always, there are a few caveats. First, the returns assume you reinvest all your dividends along the way. Second, we know hindsight is 20/20, and we can calculate the final amount relatively easily because we have the historical data. Third, this assumption does not imply that similar results can be achieved and replicated over the next couple of decades because past performance does not guarantee future returns. And the fourth is the opportunity cost—the purchasing power of $100 in 1962 was very different from that of $100 in 2021. Therefore we must acknowledge there is an opportunity cost that’s always lost/gained regardless of investing.
So what does this mean for 2022? I don’t know 🤷. S&P 500 is currently down ~15% so far this year, and I speculate we’ll probably end up in red this year because of all the shrinking corporate profits and Fed’s rate hikes, but who knows, crazier things have happened. This year has brought out plenty of noise–Disney CEO drama, Elon and Twitter distractions, FTX/Forex crypto bros continuing to hail crypto as investment vehicles, and other big stocks like Peleton down about 72 percent this year!
A good approach is probably to ignore the drama and noise and continue to invest early and often because it’s hard to beat the power of time and as the saying goes, time in the market beats timing the market.
So, I’ll just mind my own business and continue buying low-cost index funds. If this resonates with you, cool beans! If not, the beans are still cool.